Trade Analysis and Market Prediction for ADAUSDT
March 26, 2025 | Crypto News, Crypto Signal
Welcome to our latest market analysis for the ADA/USDT trading pair on Binance. In this post, we will take a closer look at recent trade activities, key indicators, and our market predictions. Whether you’re a seasoned trader or just starting, this analysis will provide valuable insights for your trading decisions.
Market Overview
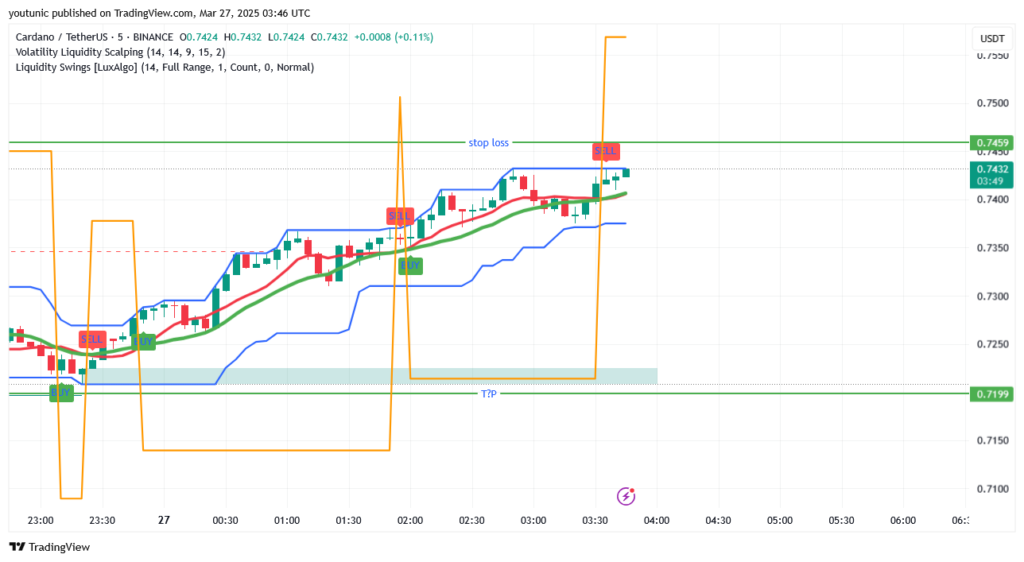
The chart we analyzed uses a 5-minute time frame and is equipped with the following technical indicators:
- Volatility Liquidity Scalping: Tracks price volatility and market liquidity.
- Liquidity Swings (LuxAlgo): Identifies potential liquidity zones.
- Moving Averages: A red short-term and a green long-term moving average to gauge market trends.
- Support and Resistance Levels: Highlight critical price levels for decision-making.
Let’s break down the trades observed in this session.
Trade 1: Bullish Buy Entry
- Entry Point: 0.7210
- Stop Loss: 0.7199 (Set below the support level)
- Take Profit: 0.7459 (Approaching the upper resistance level)
- Analysis: This trade was initiated after the price rebounded from a support zone, confirmed by a green moving average crossover. The liquidity swings indicated strong upward momentum, making it a confident buy setup.
- Outcome: The trade achieved its take profit target, yielding a solid profit.
Key Takeaway
Entering trades at support levels with confluence from moving averages increases trade accuracy.
Trade 2: Bearish Sell Entry
- Entry Point: 0.7350
- Stop Loss: 0.7459 (Above the recent high)
- Take Profit: 0.7199 (Support level)
- Analysis: Following a steep rise, a sell signal emerged as price rejection from resistance was observed. The short-term moving average crossed above the long-term average, indicating a downtrend. Liquidity levels also suggested a reversal.
- Outcome: The trade successfully hit the take profit, validating the sell setup.
Key Takeaway
Sell trades are more effective when multiple signals confirm a reversal near resistance.
Trade 3: Second Bullish Buy Entry
- Entry Point: 0.7360
- Stop Loss: 0.7300
- Take Profit: 0.7459
- Analysis: A breakout above a consolidation range occurred, confirmed by the liquidity swing indicator. Strong buying momentum and a favorable risk-to-reward ratio supported this trade.
- Outcome: The trade hit the take profit level, resulting in a successful trade.
Key Takeaway
Breakout trades are profitable when accompanied by volume and strong bullish momentum.
Current Market Prediction and Trade Setup
Based on the most recent price movement, we suggest the following trade setup:
- Entry Point: 0.7432 (Current Market Price)
- Stop Loss: 0.7390 (Below recent support)
- Take Profit: 0.7459 (Resistance level)
Supporting Factors
- The price is trading above both moving averages, indicating continued bullish momentum.
- Liquidity swings reflect a market with minimal resistance up to 0.7459.
- A tight stop loss ensures controlled risk.
Risk Management
- Risk-to-Reward Ratio: 1:2
- Adjust your position size based on risk tolerance.
Final Thoughts
Monitoring the 0.7459 resistance level will be crucial. If the price breaks above it, further upward movement is likely. On the other hand, if the resistance holds, a pullback could present new opportunities.
Stay disciplined, manage risk carefully, and trade with confidence.
Happy Trading!